In this article you’ll find:
- What is Market Snapshot?
- Why use Market Snapshot?
- How does Market Snapshot work?
- How to use Market Snapshot
- Understanding the data displayed
What is Market Snapshot? Market Snapshot is designed to deliver insights leaders can use to understand market trends, develop sales strategies, and grow group business. In an evolving competitive landscape, hospitality professionals want to understand changing market trends impacting group business. Limited data makes it difficult to understand the competitive landscape. Market Snapshot provides the information needed to fill this gap.
Why use Market Snapshot? Market Snapshot helps users better understand their market’s competitive landscape. By focusing on specific market KPIs, market segmentation, top industries for your market, as well as meeting size trends, Knowland delivers insights to help you understand what’s going on in the market today and how that compares to other time periods so that you can use this data to make better decisions. Use Market Snapshot when responding to RFPs, prioritizing prospecting efforts, and draw upon the data to speak with authority about your market to leadership.
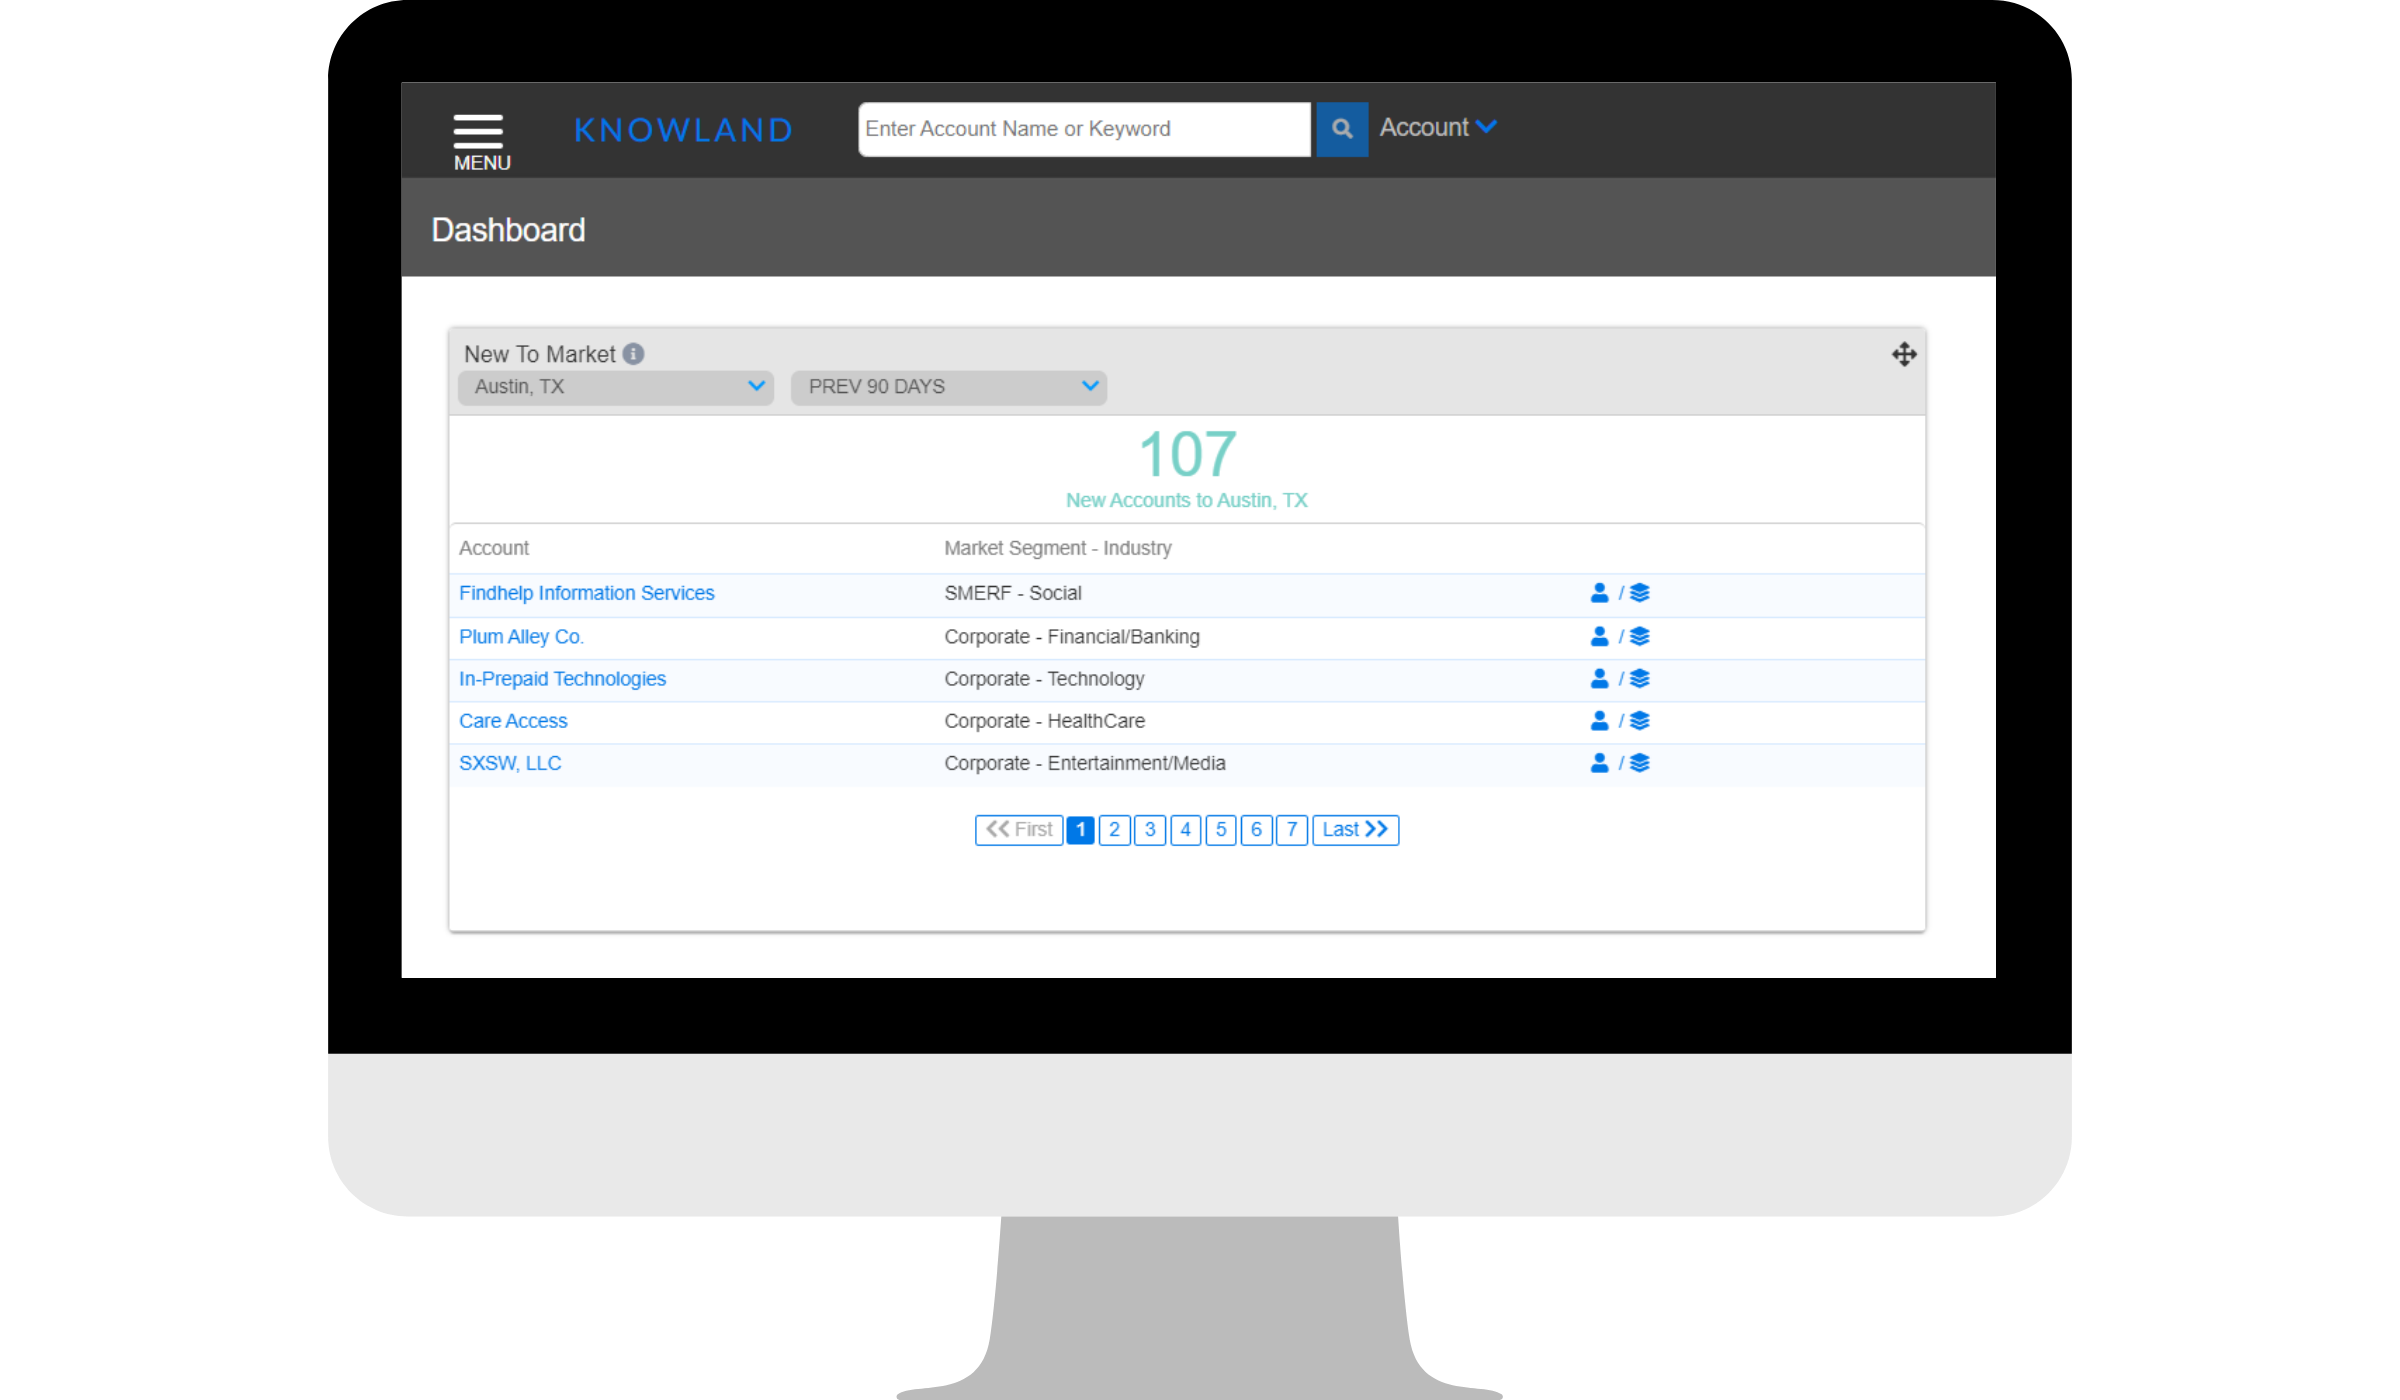
Where do I locate Market Snapshot? Market Snapshot is available for all Knowland platform subscribers. It can be accessed from two places in the Knowland Platform. From the primary Dashboard, users can click the hyperlink in the Market Segmentation Widget labeled "View Market Snapshot.”

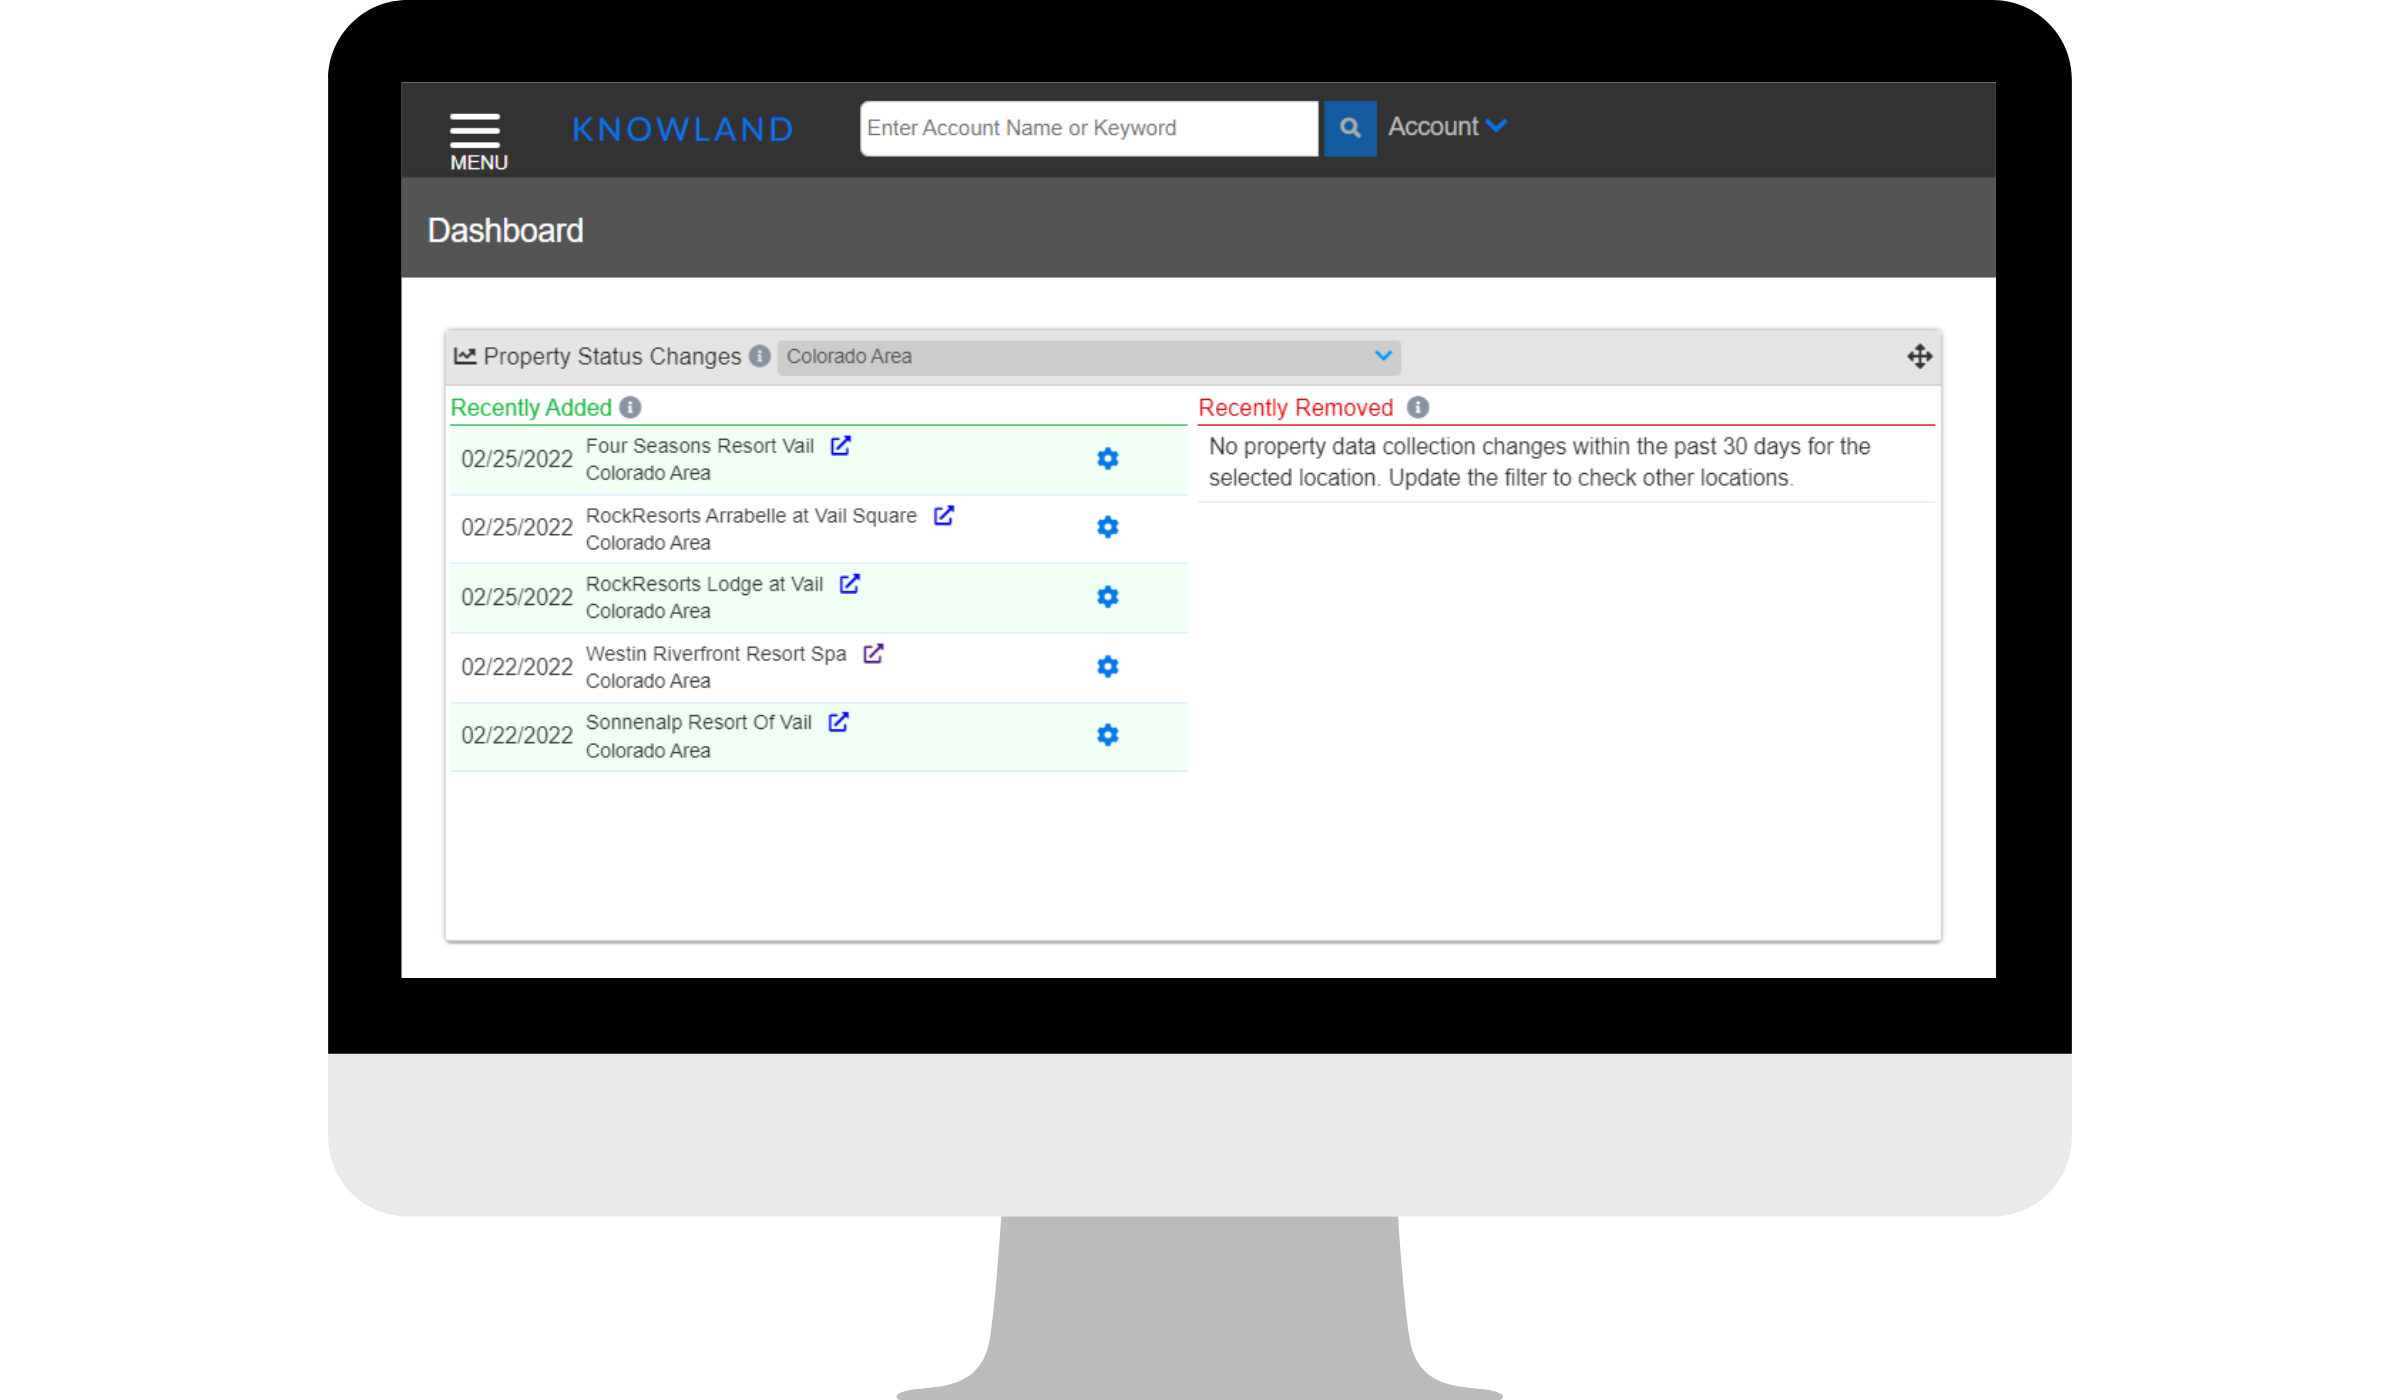
Alternatively, users can click the Menu button, navigate to Analysis, and click "Market Snapshot.”

How does Market Snapshot work? Market Snapshot draws upon the Knowland database to present key metrics for an individual market in one rolled up view. Users can customize the view by selecting both a primary Time Period and a Comparison Period to see how the key metrics have changed.
How to use Market Snapshot?
- Select a primary Time Period Date Range in the Time Period Date Picker.
-
- By default Time Period displays the last 30 days.
- Note: If a user accesses Market Snapshot from the homepage widget, the Time Period will be populated to match the widget’s selected time period filter.
2. Select a Comparison Date Range in the Time Period Date Picker.
-
- By default Comparison is the same date range as the primary Time Period in the prior year.

3. Select a Market or Region
-
- By default the user’s Main Market is displayed.
- Users with a Single +3 Competitive Markets or Unlimited Markets subscription to Knowland can select a different market or region from the selector in the top bar.
- Only one Market or Region can be selected at a time.
- Use the search box at the top of the filter to find a specific Market or Region.
- Each market is listed under the greater region in which it is included.
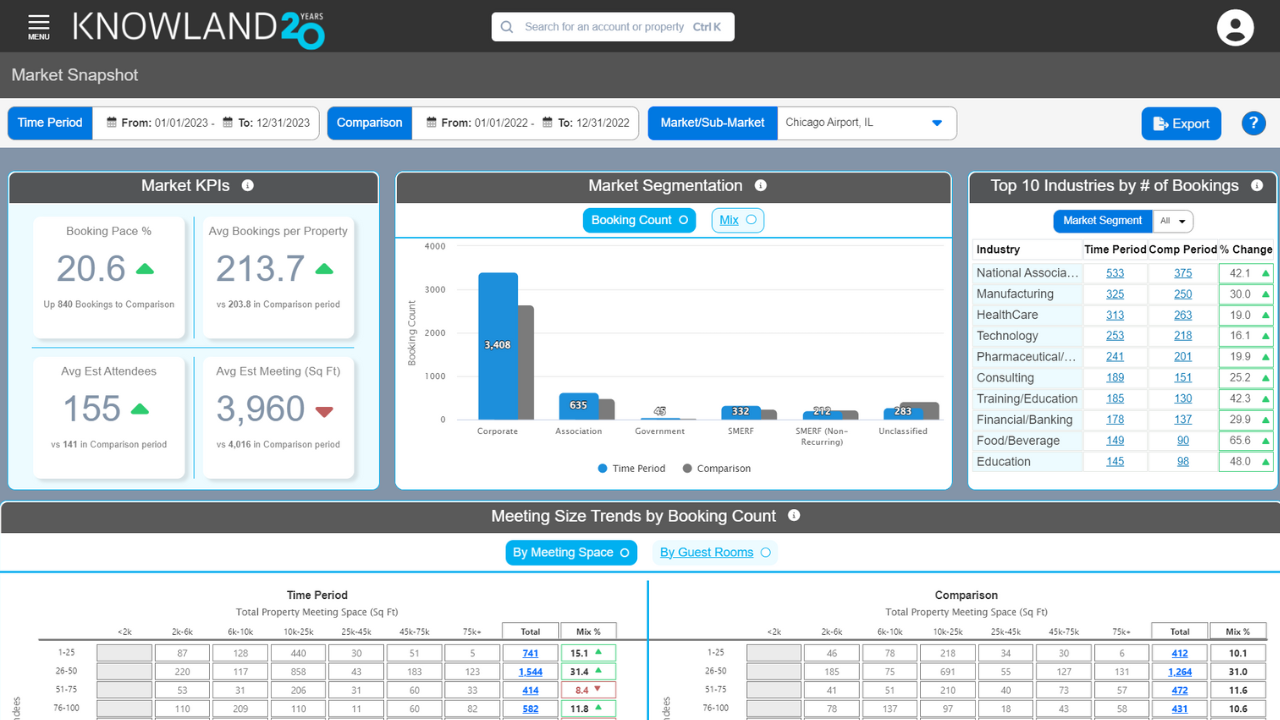
Understanding the Data: Market Snapshot is separated into 4 sections:
-
- Market KPIs
- Market Segmentation
- Top 10 Industries by # of Bookings
- Meeting Size Trends by Booking Count
Below is a description of each section.
Market KPIs: Market KPIs features four key performance indicators for the market:
-
- Booking Pace: The rate of change (as a percentage) in bookings between Time Period and Comparison.
- Average Bookings per Property
- Average Estimated Attendees
- Average Estimated Meeting (Sq Ft / Sq M)

Each metric in this section is designed to give users a baseline of performance for a market or region to use to understand the demographics of how the market is performing. Each box highlights a single metric, the period-over-period change (arrow), and footer text underneath with a reference value for the comparison period. Arrow indicators are standard red/green/em dash for up/down/no change in all boxes.
Market Segmentation: The Market Segmentation graphs are designed to give users a breakdown of group business in the Market. The graph has 2 views, Booking Count and Mix, and layers Time Period and Comparison on the same graph.
-
- The graphs can be toggled between the 2 views, Booking Count or Mix via the selection buttons at the top
- The darker blue is the active view.
- Booking count will display the total number of bookings that occurred during the selected Market and date ranges.
- Mix will display the percent each market segment’s bookings represent of the total bookings.


In each view of the graph, Time Period data is displayed in the blue bars and Comparison data is displayed in gray. Data labels on the graph represent Time Period values. Users can hover over each of the bars to see Time Period and Comparison values
Note: Knowland uses four main classifications for market segmentation based on the account’s area of business and operation status (corporate, association, government, and SMERF). For bookings not connected to an account, Knowland utilizes SMERF (Non-Recurring) and Unclassified. SMERF (Non-Recurring) is used for Social Events that are organized by private individuals, not an entity. Some examples include Weddings, Birthday Parties, and Bar Mitzvahs. The Unclassified category is used for bookings where there is not enough data to assign an “account” or determine the purpose of the meeting based on the listing on the reader board.
Top 10 Industries By # of Bookings: The Top 10 Industries by # of Bookings provides users with a breakdown of the top industries meeting in the market. The table displays the Booking Count during Time Period and Comparison with the percent change between the periods in the final column.

At the top of the table is a filter which allows users to select individual or multiple segments. The default display is All. The industries are displayed in descending order of booking count in Time Period (highest to lowest). For segments that have more than 10 industries this list is limited to the top 10. For Market Segments with fewer than 10 industries the shorter list is displayed.
The final column, % Change, displays the percent change from Time Period to Comparison and the arrow indicates if the change is up/down/ or flat.
The Booking Counts in the Time Period and Comparison columns are hyperlinked. If a user clicks on one, it will open a new tab with the SmartSearch results for the criteria passed through, allowing the user to view all the Accounts, and bookings that make up that number.
Meeting Size Trends by Booking Count: The Meetings Size Trends by Booking Count allows users to uncover shifts in meeting size trends. The section includes two tables, one for Time Period and one for Comparison. These tables can be toggled between Total Meeting Space or Guest Rooms at the Property.

-
- The table on the left is Time Period data, while the table on the right is the Comparison.
- The vertical axis is Estimated attendees per booking
- The horizontal axis is either Total Meeting Space or Guest Rooms at the property based on the selection toggle (in blue).
- By Meeting Space is the total meeting space of the property, NOT the meeting.
- By Guest Rooms is the total number of guest rooms at the property, NOT the Guest Rooms associated to the meeting.
- The table default view is by Meeting Space.
Note: If a property does not have sleeping rooms, their data is displayed in the Non-Hotel Venue column.
Totals are included for Estimated Attendees (Rows) and Property Size using either Total Meeting Space or Guest Rooms (Columns).
The final entry in the tables is the Mix percent and period-over-period indicator. The Mix calculates the percent of the total for each row or column and the period-over-period indicator denotes up/down/no change to the Comparison period.
Note: The mix percentage reflects the percentage that category represents of the total. It does not reflect a percent of change.
Exporting Market Snapshot: Users can export a screen capture of the Market Snapshot page my clicking the blue Export button in the date picker ribbon. The export will download as a PDF. For users with limited numbers of exports, the exporting of the Market Snapshot screen capture does not count as one of your monthly downloads.
For additional support, please email clientcare@knowland.com.