Daily Meeting Space Mix
Want to know what is driving market share for your comp set so that you can evaluate your own strategy? Check out the Daily Meeting Space Mix report!
The Daily Meeting Space Mix shows a snapshot of a comp set property’s meeting space used along with details of market segment mix for groups occupying the user’s comp set. Daily Meeting Space Mix can be viewed for a single day, the previous 7 days, and the previous 30 days. Users can see at a glance what is driving market share among their competitors and if this changes or supports the client’s own strategy.
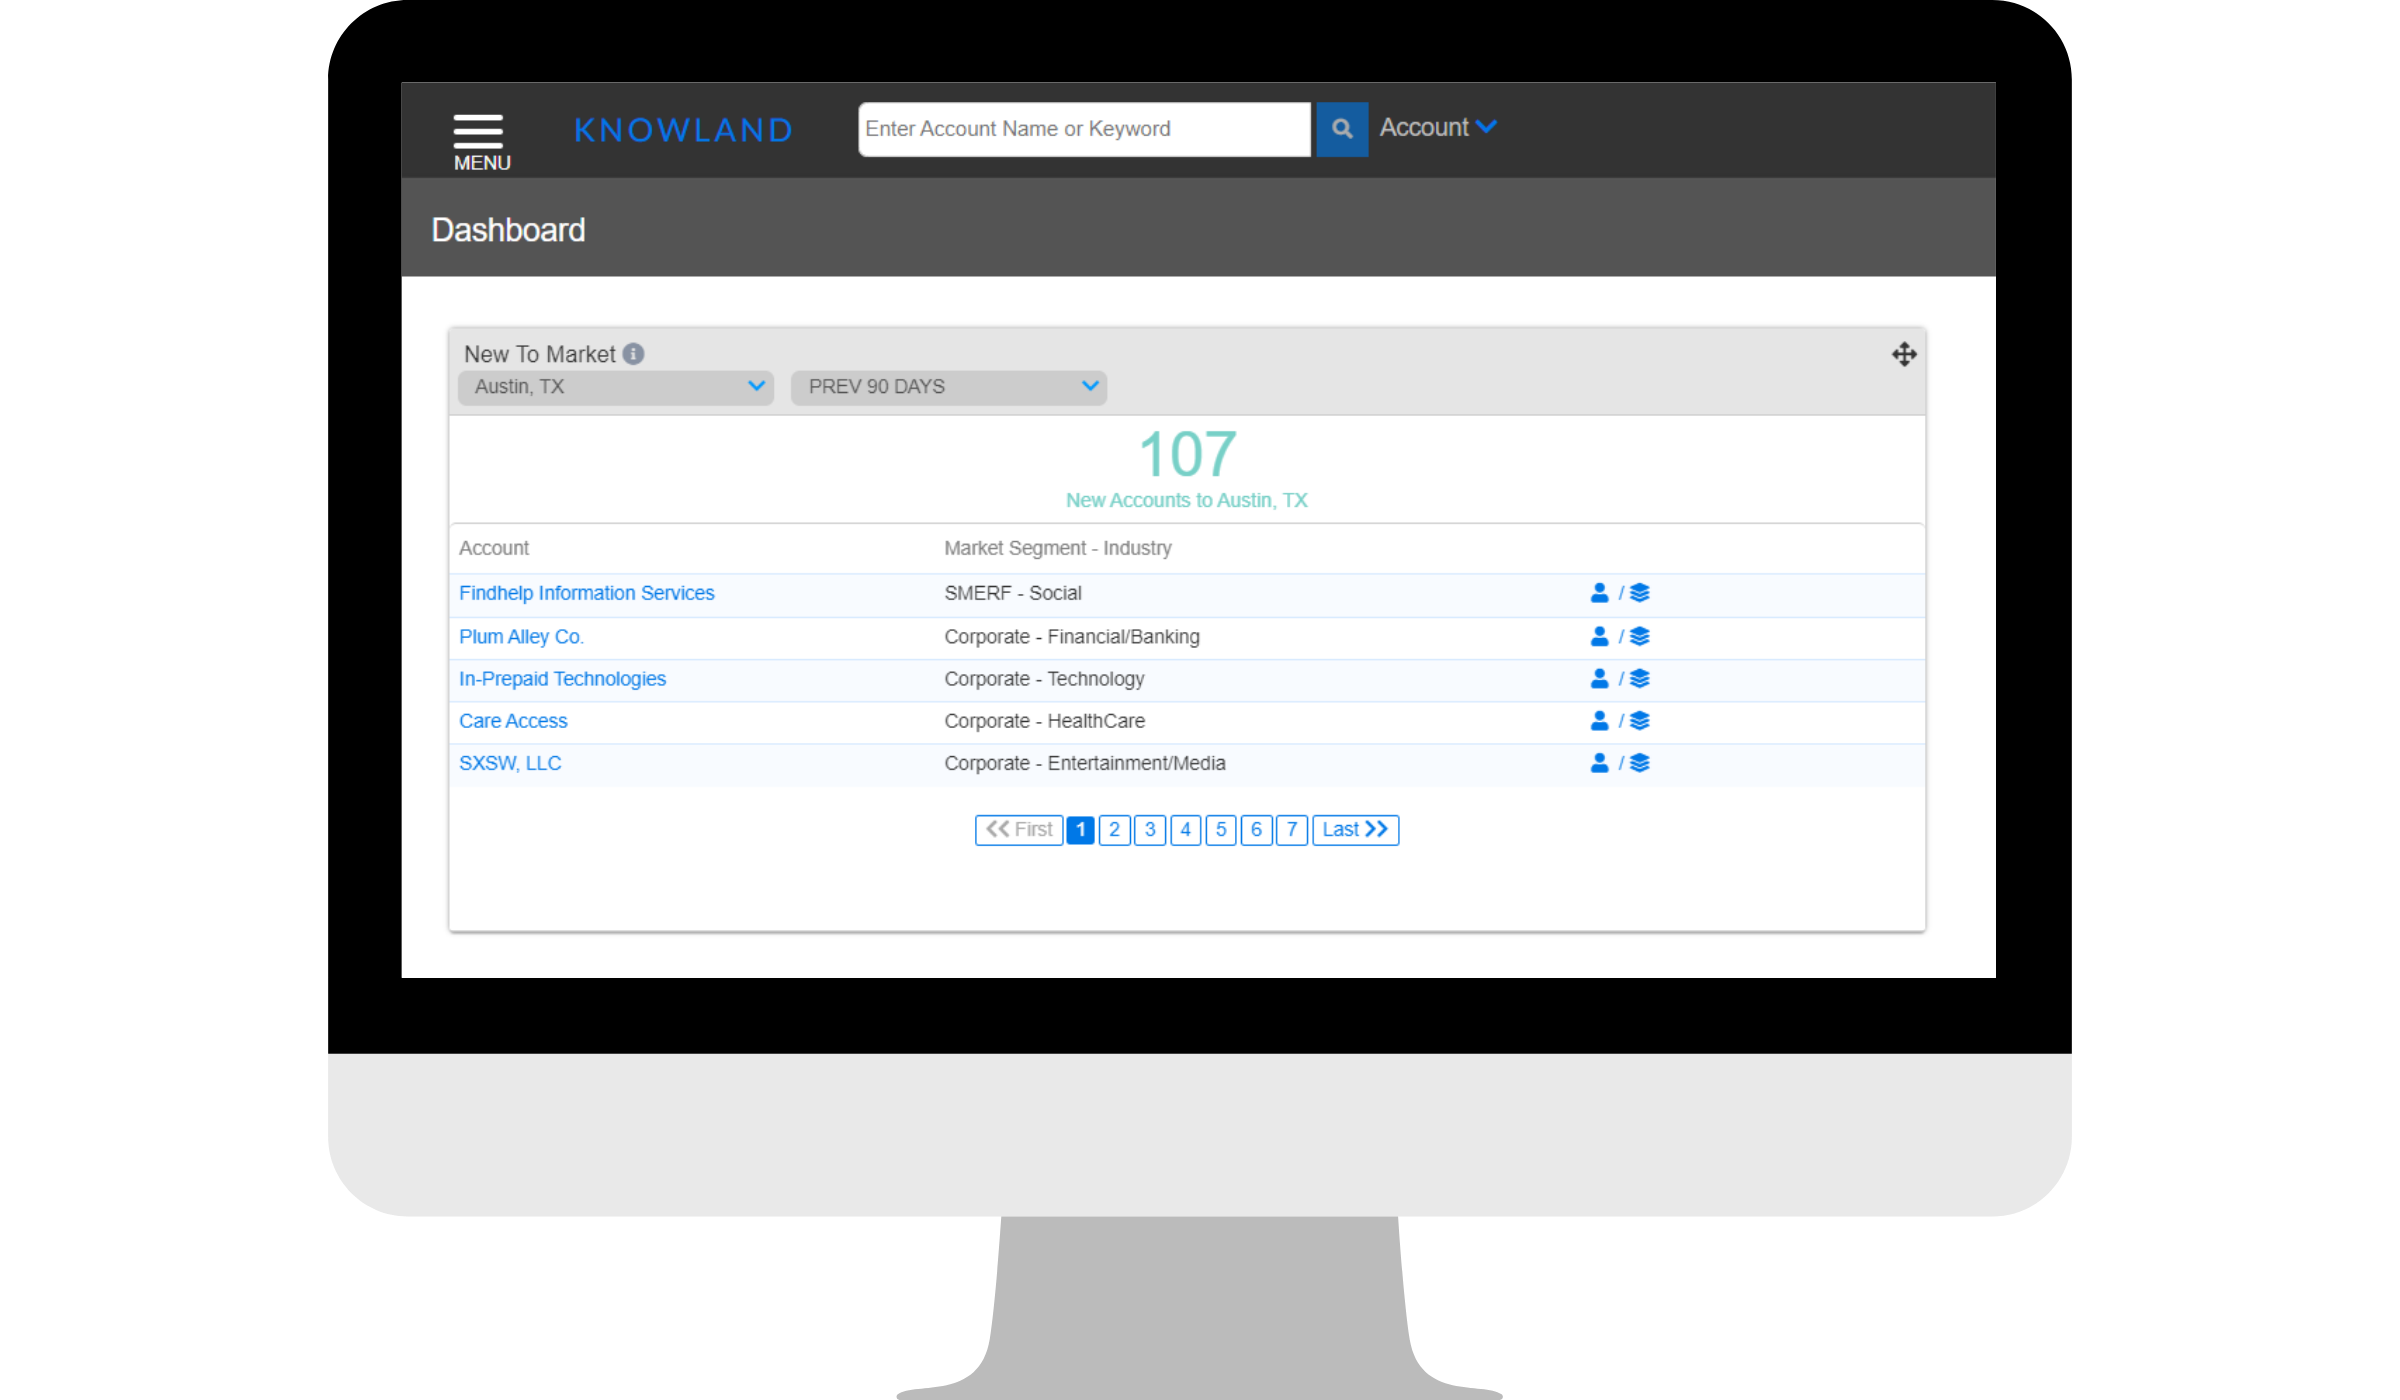
1. Login to the Knowland Platform.
2. Click on the Menu button in the top left corner of the platform.
3. Click on Daily Meeting Space Mix which can be found under the Comp Set Metrics section in the Menu.

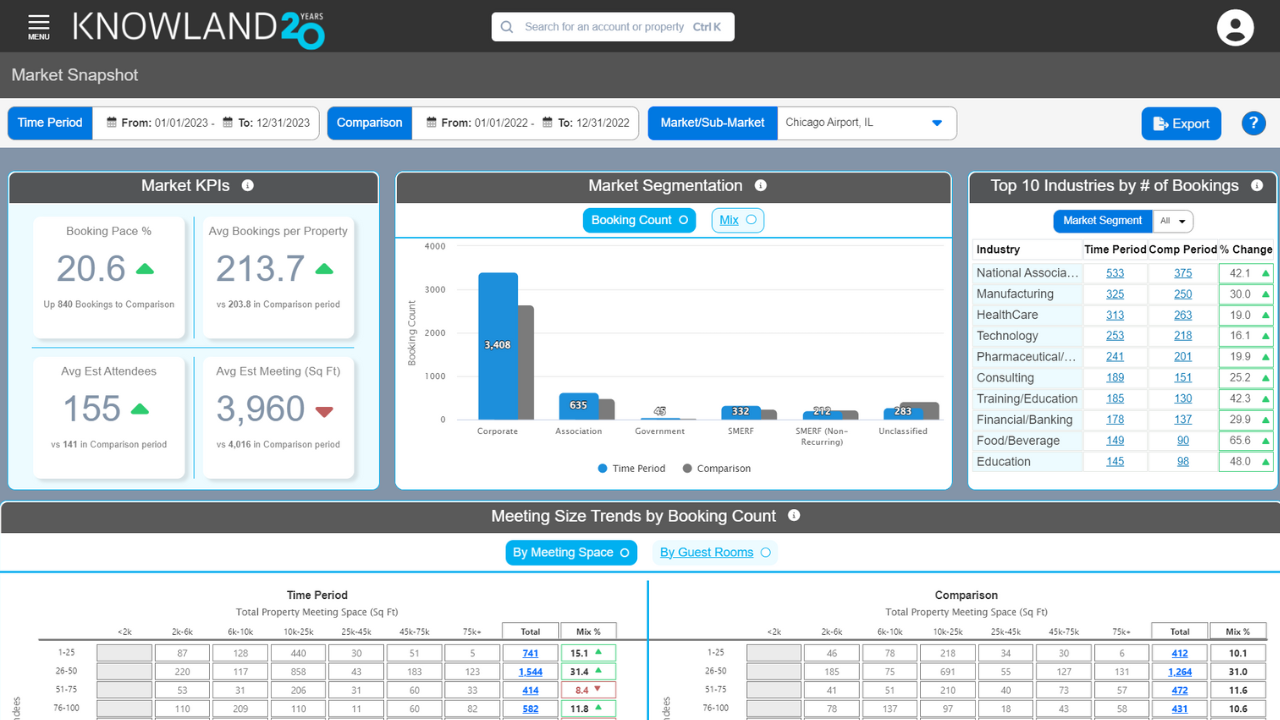
Graphs: The view is broken into two graphs for each section.
•Available Space Used: This graph shows the space used by each property in the selected competitive set. The percentage is calculated by dividing the space used by the total space available for the displayed date(s).
•Market Segment Mix of Space Used: This graph takes the space used at each property and shows you the mix of space by market segment for the displayed date(s). See who is leading what segment and understand what the competition is booking.
Actions you can take:
•Filter: Users can adjust the date and the competitive set
•See the accounts and bookings: Click any bar within a graph to view the associated accounts that are booking at the property for that date.
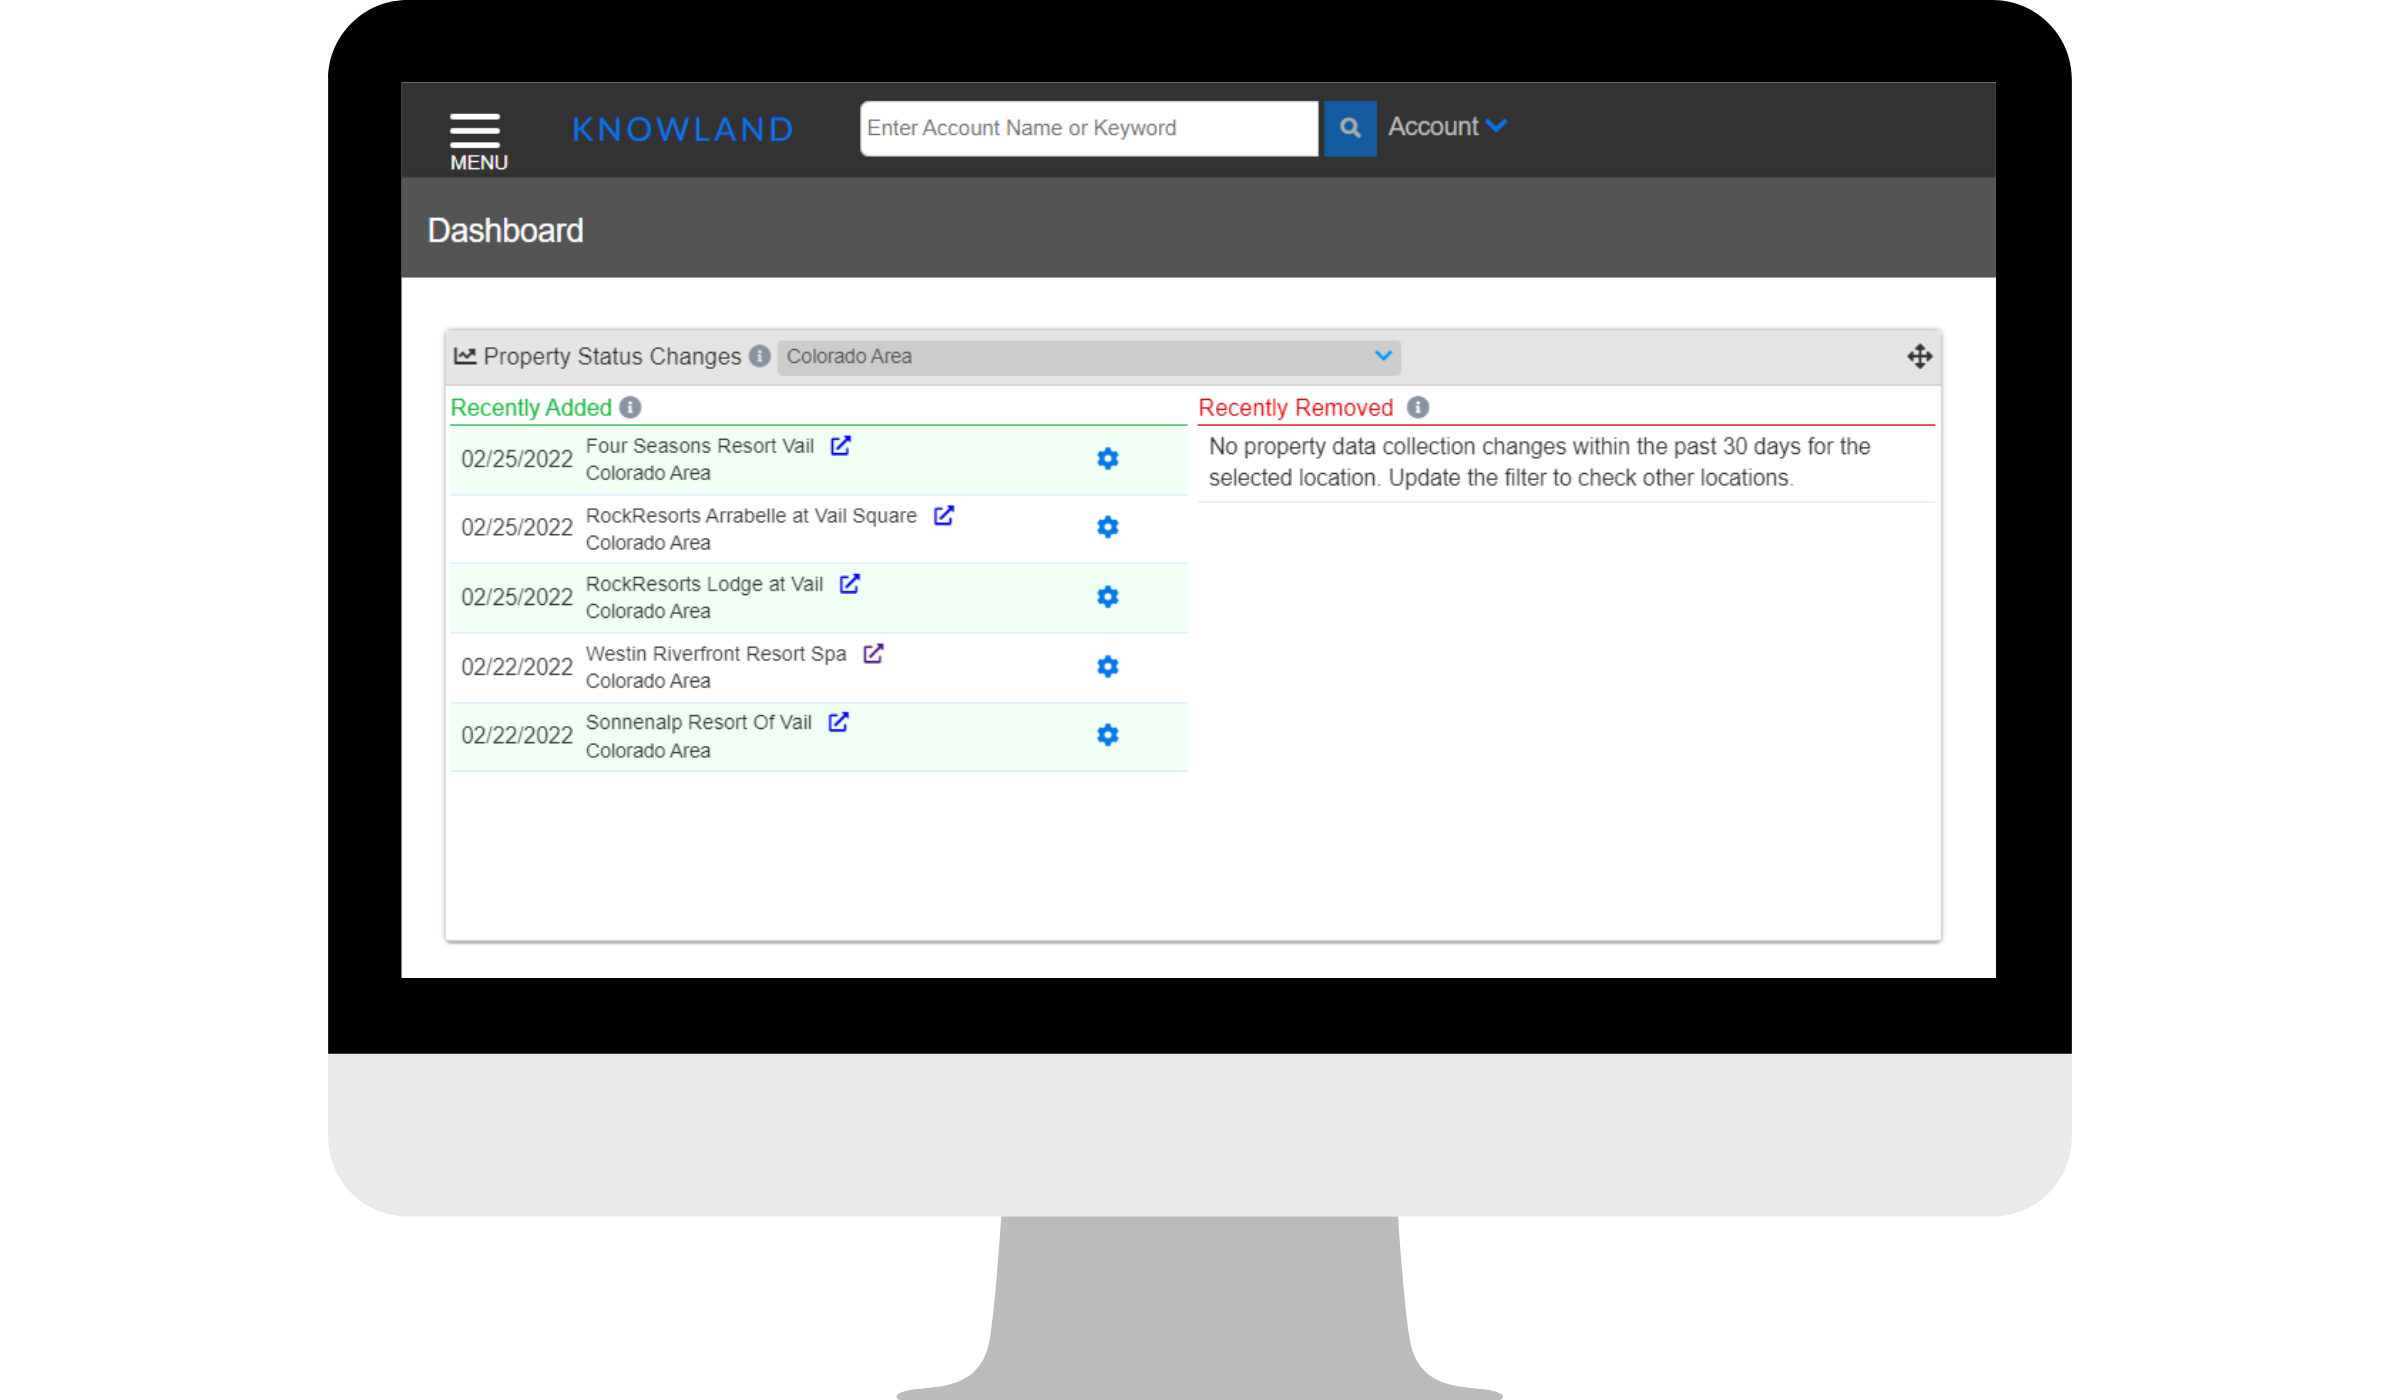
•Navigate to Property Details: Interested in looking at all the accounts booking into the property? Click the link icon next to the property name to view all past bookings and accounts for that property.

For additional support, please email clientcare@knowland.com.